I had a lot of funs exploring different projections in Week 2 of Esri MOOC Cartography.
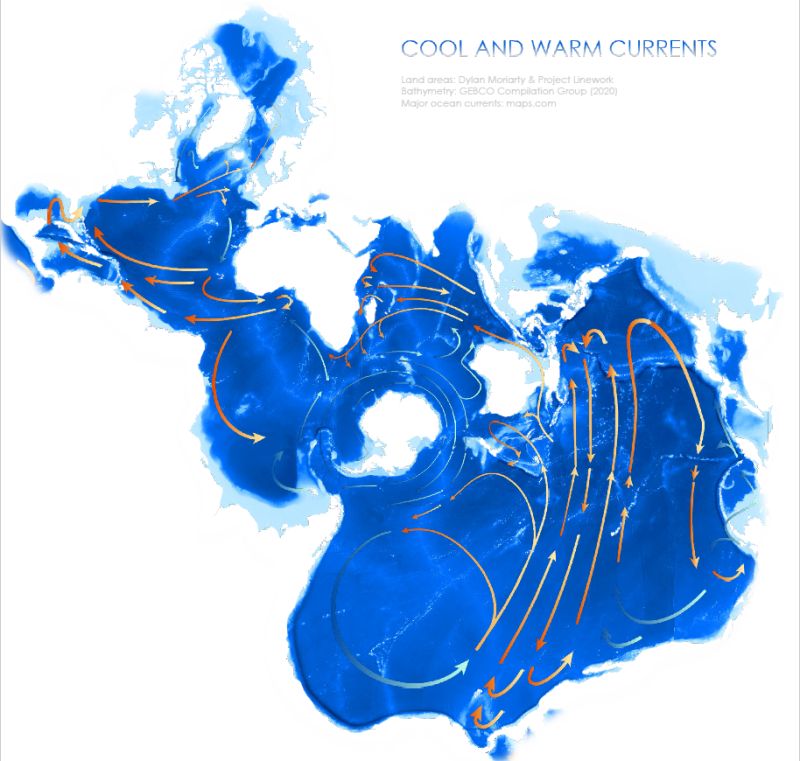
Spilhaus World Ocean Map in Square Projection is specially designed to present the oceans in a more engaging way. Several layers and techniques are employed in this map,
- Spilhaus World Ocean Map,
- Land areas hand-drawn by cartographer Dylan Moriarty,
- Bathymetric or the underwater terrain DEM by GEBCO,
- major ocean currents by Marine Conservation Institute.
Check out John Nelson’s oceanic maps. The Spilhaus projection was created by Athelstan Spilhaus in 1942!
While I was looking for more supporting facts on how do large-scale ocean currents affecting climate, why winter in England is always warmer compared with other places at the same latitude. Instead, I found a piece of interesting news reported almost 20 years ago: Britain’s moderate climate is due to the Rocky Mountains in the western U.S. but not the Gulf Stream?!
Find out more about the Rocky Mountains and Britain warm winter here.