When I was a kid, I had always thought that Greenland is just as big as the United States in terms of surface area. The only maps that I was able to have were all in Mercator projection I guess. I grab all the chances to learn about map projections and got to know more about distortions too. This week, I got to create maps with different projections following Esri MOOC Cartography.
This eye-catching hurricane map is reproduced following a tutorial by John Nelson. It is a South Pole Stereographic Projection, to highlight the circular structure of the hurricanes. Also, because most of the storms were happening in the Northern Hemisphere. Other ‘special effects’ applied to this map including vignette overlays and glowing icons.
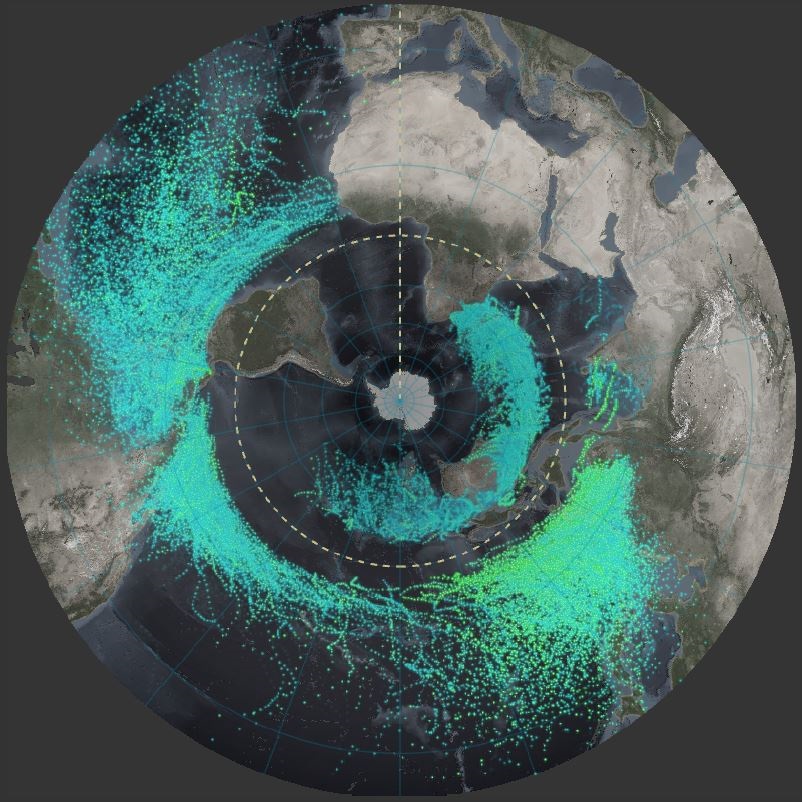
Do you know hurricanes are incapable to cross the equator?
It’s because the Coriolis effect is minimal near or at the equator. 😉
For the full How-To create the hurricanes map
Resources:
cartoblography by Kenneth Field
adventures in mapping by John Nelson
maps we love by Esri